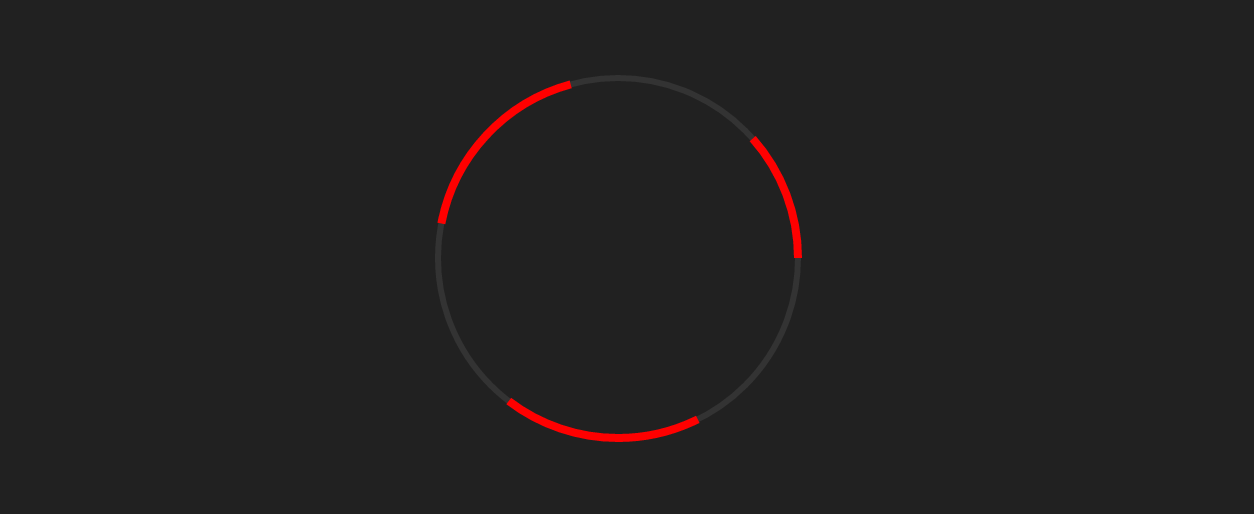
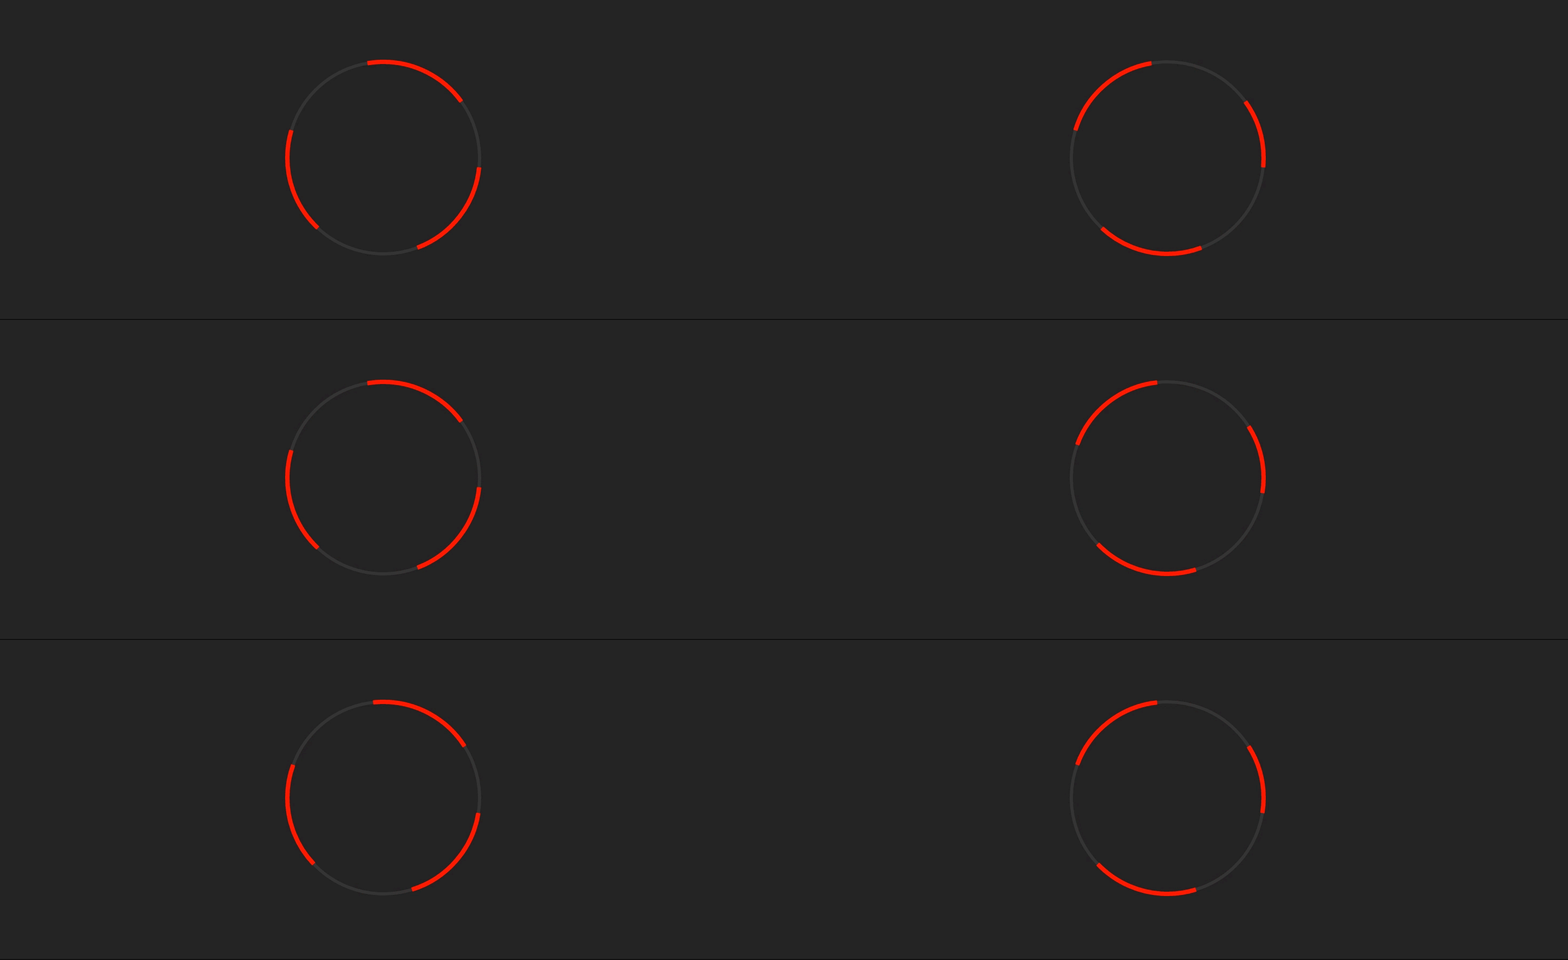
进度圈(PRogress Circles)是经典的仪表盘元素,可以将统计数据直观地展现为摘要视图。我们可以通过javascript和Canvas渲染,再配合CSS,图片或者利用svg实现一个进度圈。

使用SVG实现一个进度圈并没有想象中那么难,我们先从基本的开始:
创建背景
首先,创建一个半径为90px的圆形,然后使用cx,cy设置SVG元素的圆心位置。
我在这里还添加了一些样式属性,比如3px的灰色轮廓。
<svg width="240" height="240" xmlns="http://www.w3.org/2000/svg">
    <circle r="90" cy="120" cx="120" stroke-width="3" stroke="#333" fill="none"/>
</svg>

添加进度条效果
现在需要在刚才的背景上再添加一个表示进度的圆形:
<svg width="240" height="240" xmlns="HTTP://www.w3.org/2000/svg">
    <circle id="backdrop" r="90" cy="120" cx="120" stroke-width="3" stroke="#333" fill="none"/>
    <circle id="progress" r="90" cy="120" cx="120" stroke-width="4" stroke="red"  fill="none"/>
</svg>
好了,现在我们已经画好了需要的两个圆,可以想象,100%可以用一个全红的圆形表示,但是,如果我想表示一个具体的百分比呢?
stroke-dashArray与stroke-dashoffset
接下来需要书写css,SVG提供了stroke-dasharray和stroke-dashoffset两个属性,它们可以将刚才的圆形的轮廓变成虚线。如果两个属性都被设置成100px,会有下面的效果:
#progress {
    stroke-dasharray: 100px;
    stroke-dashoffset: 100px;
}

然后,我们可以使用@keyframe为其添加一些动画:
#progress {
    stroke-dasharray: 100px;
    stroke-dashoffset: 100px;
    Animation: progressanimation 600ms linear infinite;
}

@keyframes progressAnimation {
    from {
        stroke-dashoffset: 100px;
    }
    to {
        stroke-dashoffset: 300px;
    }
}

实现具体百分比的表示
到目前为止,动画效果,进度圆和背景圆都已经完成,最后的工作就是使用stroke-dashoffset将给定的百分比表示出来,这可能会涉及到数学方面的知识。
在这里我们使用sass完成这项工作,当然,利用JavaScript和CSSDOM这个组合也可以实现我们想要的效果(可以处理浮点数的情况)。
$radius: 90;
$percent: 83;

$circumference: (pi() * (2 * $radius));
$stroke_percentage: $circumference - (($percent / 100) * $circumference);

#progress {
    stroke-dasharray: $circumference;
    stroke-dashoffset: $circumference;
}

#progress {
    animation: progressAnimation 1600ms linear 500ms forwards;
    transition: stroke-dasharray 400ms linear;
}

@keyframes progressAnimation {
    to {
        stroke-dashoffset: $stroke_percentage;
    }
}
首先,我们设置了一些需要用到的变量,$radius(圆的半径),percent(需要展示的百分比),$circumference(圆的周长)。
接下来,对$circumference做减法算出stroke-dashoffset的值。
如果你尝试运行这个例子,会发现圆的进度条会以3点钟方向为起点,为了修正这个问题,我们需要将整个SVG 逆时针旋转90°
完成
在这里我添加了一些其它的效果,这些效果多少也都会涉及一些数学知识。
如果你有任何的问题,可以在文章下面留言。另外,在前面示例的基础上采用一些Javascript代码来处理进度条百分比的效果:


网友评论文明上网理性发言 已有0人参与
发表评论: